Equinox Gold Updates Canadian Operations Technical Outlook: Average 540,000 Ounces Gold Production per Year for Next 10 Years
VANCOUVER, British Columbia, March 30, 2026 (GLOBE NEWSWIRE) -- Equinox Gold Corp. (TSX: EQX, NYSE American: EQX) (“Equinox Gold” or the “Company”) is pleased to report results from updated technical reports for its Greenstone Gold Mine (“Greenstone”) located in Ontario, Canada and its Valentine Gold Mine (“Valentine”) located in Newfoundland & Labrador, Canada. In addition, the Company today reported its Mineral Reserves and Mineral Resources as at December 31, 2025, including 19 million ounces of gold in Mineral Reserves, 19 million ounces in Measured and Indicated Mineral Resources exclusive of Mineral Reserves, and 11 million ounces in Inferred Mineral Resources. For a detailed summary by asset, refer to the Company’s Annual Information Form, which will be available for download later today on SEDAR+ at www.sedarplus.ca, on EDGAR at www.sec.gov/edgar and on Equinox Gold’s website at www.equinoxgold.com. All dollar figures are in United States dollars unless otherwise noted.
Darren Hall, Chief Executive Officer, commented: “Our immediate focus at Greenstone is executing the ramp-up and achieving sustained nameplate milling capacity of 27,000 tonnes per day. Delivering consistent performance at this level will establish Greenstone as a cornerstone asset within our portfolio. At this throughput rate, the updated technical report outlines an operation expected to average approximately 320,000 ounces of gold annually over the next decade, representing a strong outcome for a long-life asset located in a Tier 1 jurisdiction.
“Once we achieve stable nameplate performance, we see additional opportunities to further optimize the operation and create value. These include increasing mill throughput toward 30,000 tonnes per day, incorporating higher-grade underground resources into future mine plans, and advancing near-mine and regional exploration targets across our large, 400 km2 land package. With 1.6 million ounces of Measured and Indicated Resources and 1.2 million ounces of Inferred Resources delineated in the underground deposit, and an additional 1.1 million ounces of Indicated Resources identified to date on the broader land package, we believe there is meaningful potential to enhance grades, extend mine life and potentially increase annual production over time.
“At Valentine, the updated technical report highlights significant benefits from the planned Phase 2 expansion. Following completion of Phase 2 construction, which is targeted for H2 2028, throughput is expected to increase to approximately 13,700 tonnes per day (5.0 Mtpa), and annual gold production is expected to average approximately 223,000 ounces per year for the subsequent ten years.
“We see additional strong opportunities to extend mine life and further enhance the value of this asset. Ongoing delineation efforts at the Frank Zone have the potential to evolve into a fourth open pit, and we are advancing drilling this year to better define that opportunity. Combined with ongoing exploration across the broader, 320 km2 land package and future throughput optimization potential, Valentine represents a long-life, scalable production platform capable of delivering sustainable growth well beyond the current mine plan.
“Additionally, we remain focused on unlocking further value through the growth and enhancement of our overall Mineral Reserves and Mineral Resources, supported by a robust $70 to $80 million exploration budget for 2026.”
CANADIAN OPERATIONS HIGHLIGHTS
- Average 543,000 ounces of annual gold production from Canada over the next 10 years (2026-2036) based on Proven and Probable Mineral Reserves only
- 8.1 million ounces (“Moz”) combined Proven & Probable Mineral Reserves
- 4.1 Moz combined Measured & Indicated (“M&I”) Mineral Resources, exclusive of Mineral Reserves
- 2.8 Moz combined Inferred Mineral Resources
- Strong exploration potential at both Canadian assets
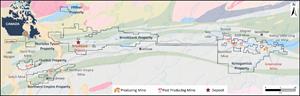
- Greenstone underground resource not included in mine plan provides future opportunity to enhance mill feed with higher-grade underground resources alongside open-pit production
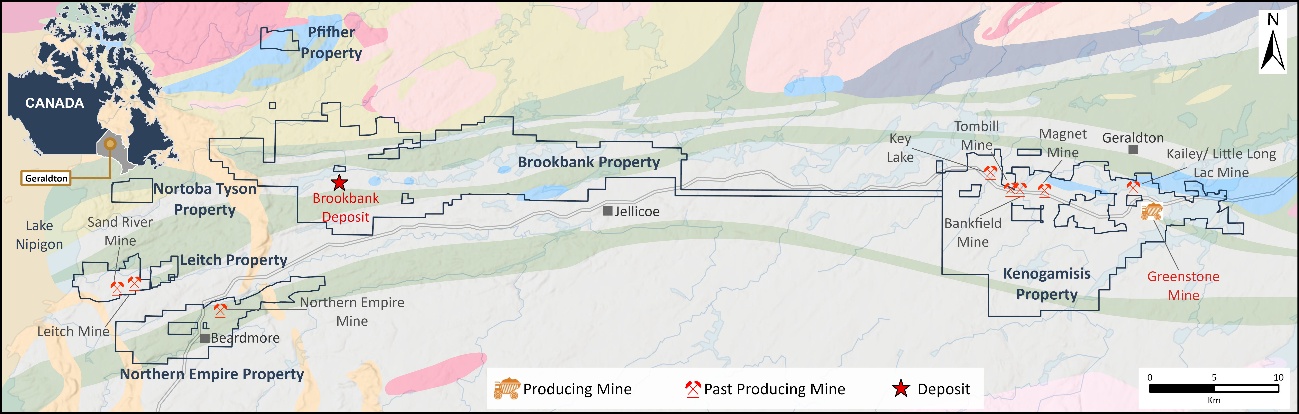
- Numerous underexplored past-producing mines and deposits on the ~400 km2 Greenstone land package
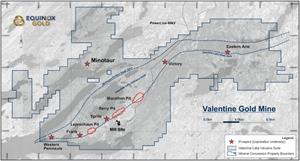
- Valentine Frank Zone not included in current reserve and resource estimates, along with new Minotaur discovery and other emerging targets; less than 15% of the ~320 km2 property explored to date
GREENSTONE GOLD MINE
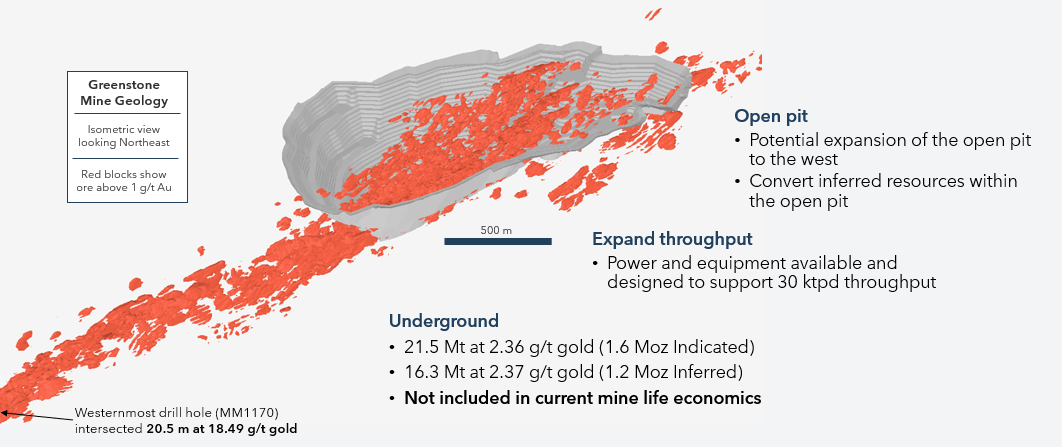
- 320,000 oz average annual gold production over the next 10 years (2026-2036) at average recovery of 87.5%
- 9.82 million tonnes per annum (“Mtpa”) milled on average
- 1.16 grams per tonne (“g/t”) gold average mill feed grade
- 5.3 Moz open pit Proven & Probable Mineral Reserves
- 1.3 Moz open pit M&I Mineral Resources; 418 Koz open pit Inferred Mineral Resources
- 1.6 Moz underground M&I Mineral Resources; 1.2 Moz underground Inferred Mineral Resources
- 1.1 Moz Indicated Mineral Resources and 409 Koz Inferred Mineral Resources currently identified in other gold assets on the Greenstone land package
Opportunities
- Potential mill throughput increase toward 30,000 tonnes per day (“tpd”)
- Conversion of underground and satellite Mineral Resources to Mineral Reserves
- Mine life extension and/or annual production increase from higher-grade underground Mineral Resources not included in current mine plan
- Mine life extension from existing deposits potentially within trucking distance of the mine (Kailey, Key Lake and Brookbank)
- Exploration potential from three past-producing mines on the property with historical production of more than 1 Moz at grades greater than 10 g/t gold with no modern exploration
Greenstone Gold Mine: Open-pit and Underground Expansion Opportunities
Greenstone Gold Mine: Near-mine and Regional Opportunities
VALENTINE GOLD MINE
Phase 2 Expansion highlights
- Increasing throughput from 2.5 Mtpa to 5.0 Mtpa
- $414 million capital cost for mill expansion, fleet expansion and on-site infrastructure expansion, including 20% contingency
- 24-month construction anticipated to begin Q3 2026 following Board of Directors approval; to be funded through cash flow from operating mines and available credit facility
Combined Phase 1 and Phase 2 highlights
- 2.7 Moz Proven & Probable Mineral Reserves
- 1.2 Moz M&I Mineral Resources; 1.1 Moz Inferred Mineral Resources
- $3.1 billion after-tax NPV5 at $4,500/oz gold
- $4.3 billion after-tax life of mine (“LOM”) (2026-2037) cumulative net cash flow at $4,500/oz gold
- 223,000 oz average annual gold production over the next 10 years
- 4.31 Mtpa milled on average
- 1.69 g/t gold average mill feed grade
- Average LOM total cash costs of $1,580/oz and all-in sustaining costs of $1,665/oz
Opportunities
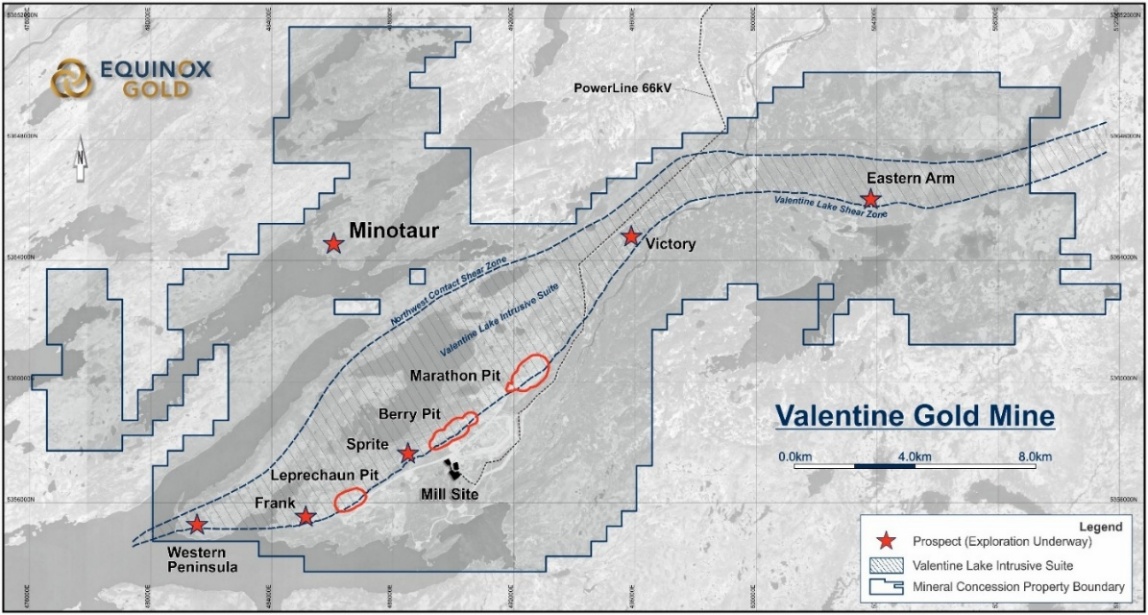
- Frank Zone exploration results not yet included in current Mineral Resource estimate
- Located less than 1km southwest along trend from Leprechaun open-pit deposit
- Exploration to date has delineated a gold corridor more than 1km in length with geology and mineralogy characteristics similar to the three operating open pits
- Multi-rig drill program underway targeting over 25,000 metres of drilling; initial resource estimate expected in Q4 2026
Valentine Gold Mine: Property Overview
TECHNICAL REPORTS
Updated technical reports for Greenstone and Valentine will be available for download later today on SEDAR+ at www.sedarplus.ca, on EDGAR at www.sec.gov/edgar and on Equinox Gold’s website at www.equinoxgold.com.
The Valentine technical report includes a full economic analysis of the life of mine, including annual cost and cash flow information, given the anticipated Phase 2 expansion. The Greenstone technical report provides updated technical information for the mine as well as life-of-mine operating costs and capital expenditures, but does not include an economic analysis, as allowed under the producing issuer exemption.
ABOUT EQUINOX GOLD
Equinox Gold (TSX: EQX, NYSE-A: EQX) is a Canadian mining company positioned for growth with a strong foundation of high-quality, long-life gold operations in Canada and across the Americas, and a pipeline of development and expansion projects. Founded and chaired by renowned mining entrepreneur Ross Beaty and guided by a seasoned leadership team with broad expertise, the Company is focused on disciplined execution, operational excellence and long-term value creation. Equinox Gold offers investors meaningful exposure to gold with a diversified portfolio and clear path to growth. Learn more at www.equinoxgold.com or contact ir@equinoxgold.com.
EQUINOX GOLD CONTACT
Ryan King
EVP Capital Markets
T: 778.998.3700
E: ryan.king@equinoxgold.com
E: ir@equinoxgold.com
QUALIFIED PERSON AND TECHNICAL INFORMATION
The scientific and technical information contained in this news release was approved by Matthew MacPhail, P.Eng., Senior Vice President Business Planning and Technical Services for Equinox Gold and a “Qualified Person” under National Instrument 43-101.
APPENDIX
Greenstone Gold Mine – Open-pit Mineral Reserve Estimate
| Category |
Tonnage (kt) |
Gold Grade (g/t) |
Contained Gold (koz) |
||
| Proven | 6,900 | 0.75 | 164 | ||
| Probable | 172,500 | 0.93 | 5,169 | ||
| Total Proven & Probable | 179,000 | 0.93 | 5,334 | ||
Notes:
The Mineral Reserves were prepared by Philippe Lebleu, P.Eng., with an effective date of December 31, 2025. The Mineral Reserves estimate was completed in accordance with the CIM Definition Standards (2014) and the CIM Best Practice Guidelines (2019). Metallurgical recovery is estimated using a multivariant regression equation to predict leach residue. Mineral Reserves are estimated based on a mine plan using a minimum recovered gold cut-off grade of 0.20 g/t gold. Mineral Reserves are estimated using a long-term gold price of $2,100/oz and a CAD:USD exchange rate of 0.75, average processing costs of $12.2/t of ore, G&A of $6.2/t of ore and mining costs of $2.74/t mined. Mining dilution is modelled by regularization and applying a 3% factor to the grades. Reserves include 11 Mt at 0.51 g/t of previously stockpiled ore. Numbers may not sum due to rounding.
Greenstone Gold Mine – Mineral Resource Estimate (exclusive of Mineral Reserves)
| Category |
Open Pit >0.18 g/t Gold |
Underground >1.10 g/t Gold |
||||||||
|
Tonnage (kt) |
Gold Grade (g/t) |
Contained Gold (koz) |
Tonnage (kt) |
Gold Grade (g/t) |
Contained Gold (koz) |
|||||
| Measured | 21 | 0.51 | 0 | 1 | 0.63 | 0 | ||||
| Indicated | 32,470 | 1.28 | 1,335 | 21,479 | 2.36 | 1,631 | ||||
| Total M&I | 32,491 | 1.28 | 1,335 | 21,479 | 2.36 | 1,631 | ||||
| Inferred | 14,847 | 0.88 | 418 | 16,335 | 2.37 | 1,245 | ||||
Notes:
The Mineral Resource statement has been prepared by Niel de Bruin, P.Geo., and has an effective date of December 31, 2025. The Mineral Resource estimate was completed in accordance with the CIM Definition Standards (2014) and the CIM Best Practice Guidelines (2019). Mineral Resources that are not Mineral Reserves do not have demonstrated economic viability. Mineral Resources are reported exclusive of Mineral Reserves. Open pit Mineral Resources are reported at a minimum recovered gold cut-off grade of 0.18 g/t gold constrained within a pit shell. The cut-off grade and pseudo flow pit shell use a long-term gold price of $2,300/oz, a USD:CAD exchange rate of 1.33, average mining costs of $3.4/t, processing costs of $12.2/t, refining and transportation costs of $3.3/oz of gold recovered and G&A costs of $6.8/t. Underground mineral resources are reported within mineable stopes based on a conceptual mining method at a minimum recovered gold cut-off grade of 1.10 g/t gold. A gold price of $2,300/oz was used to determine the underground cut-off grade, average mining costs of $65/t, processing costs of $12.2/t, refining and transportation costs of $3.3/oz of gold recovered, and process sustaining capital costs of $1.2/t. Average metallurgical recovery is estimated using a multivariant regression equation to predict leach residue grade. The average metallurgical recovery for the open pit is 86.4% and underground value is 91%. A royalty rate of 3.0% is assumed. Numbers may not sum due to rounding. The Qualified Person is not aware of any environmental, permitting, legal, title, taxation, socio-economic, marketing, political, or other relevant factors that could materially affect the Mineral Resource estimate, except for uncertainty around the position, size, and geometry of voids from historical mine workings within the pit, which remains a risk to the Mineral Resource estimate.
Other Deposits on the Greenstone Land Package – Mineral Resource Estimate (exclusive of Mineral Reserves)
| Deposit | Mining Method | Category |
Tonnage (kt) |
Gold Grade (g/t) |
Contained Gold (koz) |
||
| Brookbank | Open pit | Indicated | 7,190 | 1.88 | 434 | ||
| Inferred | 152 | 0.69 | 3 | ||||
| Underground | Indicated | 1,856 | 4.67 | 279 | |||
| Inferred | 1,339 | 2.55 | 110 | ||||
| Key Lake | Open Pit | Indicated | 7,738 | 0.82 | 205 | ||
| Inferred | 4,905 | 1.00 | 158 | ||||
| Kailey | Open Pit | Indicated | 12,038 | 0.60 | 231 | ||
| Inferred | 7,758 | 0.55 | 138 | ||||
Notes:
Brookbank
There are no Mineral Reserves at Brookbank. Mineral Resources are not Mineral Reserves as they do not have demonstrated economic viability. The Mineral Resource statement has been prepared by Niel de Bruin, P.Geo., with an effective date of December 31, 2025. The Mineral Resource estimate was completed in accordance with the CIM Definition Standards (2014) and the CIM Best Practice Guidelines (2019). Open pit Mineral Resources are constrained within an optimized pit shell using a gold price of $2,300/oz, a USD:CAD exchange rate of 1.33, mining cost of $3.4/t, processing cost of $12.2/t, incremental ore haulage cost of $13.8/t milled and G&A cost of $6.8/t. Mineral Resources are quoted at an open pit lower cut-off grade of 0.18 g/t gold. Underground mineral resources are reported within mineable stopes based on a conceptual mining method at a cut-off grade of 1.31 g/t gold. A long-term gold price of $2,300/oz, average mining costs of $65/t, processing costs of $12.2/t, a cost of $13.8/t for incremental ore haulage and refining and transportation costs of $3.3/oz of gold recovered were used to determine the underground cut-off grade. An average metallurgical recovery of 92% for open pit mining, 96% for underground mining, and a royalty rate of 3.0% are assumed. Numbers may not sum to rounding. The Qualified Person is not aware of any environmental, permitting, legal, title, taxation, socio-economic, marketing, political, or other relevant factors that could materially affect the Mineral Resource estimate.
Key Lake
There are no Mineral Reserves at Key Lake. Mineral Resources are not Mineral Reserves as they do not have demonstrated economic viability. The Mineral Resource statement has been prepared by Niel de Bruin, P.Geo., with an effective date of December 31, 2025. The Mineral Resource estimate was completed in accordance with the CIM Definition Standards (2014) and the CIM Best Practice Guidelines (2019). Open pit Mineral Resources are quoted at an open pit lower cut-off grade of 0.18 g/t gold and reported within a pit shell. The optimization of the pit shell is based on a gold price of $2,300/oz, a USD:CAD exchange rate of 1.33, average mining costs of $3.4/t, processing costs of $12.2/t, incremental ore haulage costs of $3.5/t, refining and transportation costs of $3.3/oz of gold recovered, and G&A costs of $6.8/t. The average metallurgical recovery is 90% and a royalty rate of 3.0% is assumed. No underground Mineral Resources are quoted. Numbers may not sum due to rounding. The Qualified Person is not aware of any environmental, permitting, legal, title, taxation, socio-economic, marketing, political, or other relevant factors that could materially affect the Mineral Resource estimate.
Kailey
There are no Mineral Reserves at Kailey. Mineral Resources are not Mineral Reserves as they do not have demonstrated economic viability. The Mineral Resource statement has been prepared by Niel de Bruin, P.Geo., with an effective date of December 31, 2025. The Mineral Resource estimate was completed in accordance with the CIM Definition Standards (2014) and the CIM Best Practice Guidelines (2019).Open pit Mineral Resources are constrained within an optimized pit shell using a gold price using a gold price of $2,300/oz, a USD:CAD exchange rate of 1.33, mining cost of $3.4/t, processing cost of $12.2/t, incremental ore haulage cost of $1.3/t milled, G&A cost of $6.8/t, a metallurgical recovery of 90% and a royalty rate of 3.0%. No underground Mineral Resources are quoted. Mineral Resources are quoted at an open pit lower cut-off grade of 0.18 g/t gold. Numbers may not sum to rounding. The Qualified Person is not aware of any environmental, permitting, legal, title, taxation, socio-economic, marketing, political, or other relevant factors that could materially affect the Mineral Resource estimates.
Valentine Gold Mine – Mineral Reserve Estimate
| Category |
Tonnage (kt) |
Gold Grade (g/t) |
Contained Gold (koz) |
||
| Proven | 22,096 | 1.87 | 1,330 | ||
| Probable | 29,394 | 1.50 | 1,418 | ||
| Total Proven & Probable | 51,490 | 1.66 | 2,748 | ||
Notes:
The Mineral Reserve estimates were prepared by Jeffrey Colden, P.Eng., reported using the CIM (2014) definitions, and have an effective date of December 31, 2025. Mineral Reserves are mined tonnes and grade; the reference point is the mill feed at the primary crusher. Mineral Reserves are reported at a cut-off grade of 0.45 g/t gold. Cut-off grade assumes US$2,100/oz gold at a currency exchange rate of US$0.714 per C$1.00; 99.8% payable gold; US$5.00/oz off-site costs (refining and transport); and uses a 93.1% metallurgical recovery. The cut-off grade covers processing costs of C$22.75/t, administrative (G&A) costs of C$14.38/t, and a stockpile rehandle cost of C$1.85/t. Mining loss and dilution is based on diluting the Resource model to a 6 m x 6 m x 6 m model and including additional mining losses estimated for the removal of isolated blocks (surrounded by waste) and low-grade (<0.55 g/t gold) blocks bounded by waste on three sides. Numbers have been rounded as required by reporting guidelines and may not add. The Qualified Person is not aware of any mining, metallurgical, infrastructure, permitting, or other relevant factors that could materially affect the Mineral Reserve estimate, unless outlined in this report
Valentine Gold Mine – Mineral Resource Estimate (exclusive of Mineral Reserves)
| Category |
Tonnage (kt) |
Gold Grade (g/t) |
Contained Gold (koz) |
||
| Measured | 6,428 | 1.18 | 243 | ||
| Indicated | 22,961 | 1.25 | 926 | ||
| Total M&I | 29,389 | 1.24 | 1,169 | ||
| Inferred | 31,989 | 1.10 | 1,128 | ||
Notes:
The Mineral Resource statement has been prepared by Niel de Bruin, P.Geo., and has an effective date of December 31, 2025. The Mineral Resource estimate was completed in accordance with the CIM Definition Standards (2014) and the CIM Best Practice Guidelines (2019). Mineral Resources are not Mineral Reserves and do not have demonstrated economic viability. Mineral Resources are presented exclusive of Mineral Reserves. Open pit resources are reported at a cut-off grade of 0.30 g/t gold and are constrained within an optimized pit shell. The optimized pit shell was generated using a gold price of $2,400/oz, a USD:CAD exchange rate of 1.31, average mining and processing costs of $17.4/t, G&A costs of $4.5/t of ore, and refining and transportation costs of $5.3/oz of recovered gold. Underground mineral resources are reported within conceptual mineable stopes using a cut-off grade of 1.21 g/t gold. A long-term gold price of $2,300/oz, a USD:CAD exchange rate of 1.31, average mining and processing costs of $79.8/t, refining and transportation costs of $5/oz of recovered gold, and process sustaining capital costs of $1.2/t were used for the underground cut-off grade calculation. Underground stope sizes were on an average strike length of 5 m, a mining height of 3 m, and a stope width corresponding to the full extent of the modelled mineralized zone. The average metallurgical recovery is 95% and a royalty rate of 3.0% is assumed. Numbers may not sum due to rounding. The Qualified Person is not aware of any environmental, permitting, legal, title, taxation, socio-economic, marketing, political, or other relevant factors that could materially affect the Mineral Resource estimate.
Cautionary Notes & Forward-Looking Statements
This news release contains certain forward-looking information and forward-looking statements within the meaning of applicable securities legislation and may include future-oriented financial information or financial outlook information (collectively “Forward-looking Information”). Actual results of operations and the ensuing financial results may vary materially from the amounts set out in any Forward-looking Information. Forward-looking Information in this news release relates to, among other things: the Company’s average annual gold production over a ten-year period, the Company’s ability to successfully achieve the results outlined in the Greenstone technical report and to follow through on the opportunities outlined therein, the Company’s ability to successfully advance the Valentine Phase 2 expansion and achieve the results outlined in the Valentine technical report, the strategic vision for the Company and expectations regarding production capabilities and future financial or operating performance, the conversion of Mineral Resources to Mineral Reserves, and the Company’s ability to successfully advance its growth and development projects and anticipated benefits arising from the same, including the economic and social benefits and value for Equinox Gold shareholders expected from the Greenstone Mine and the Valentine Phase 2 expansion. Forward-looking Information is generally identified using words like “will”, “potential”, “growth”, “future”, “target”, “expect”, “increase”, “achieve”, “advance”, “extend”, “enhance”, and similar expressions and phrases or statements that certain actions, events or results “may”, “could”, or “should”, or the negative connotation of such terms, are intended to identify Forward-looking Information. Although the Company believes that the expectations reflected in such Forward-looking Information are reasonable, undue reliance should not be placed on Forward-looking Information since the Company can give no assurance that such expectations will prove to be correct. The Company has based Forward-looking Information on the Company’s current expectations and projections about future events and these assumptions include: Equinox Gold’s ability to achieve the exploration, production, cost and development expectations for its respective operations and projects, including Greenstone and Valentine; prices for gold remaining as estimated; the exchange rate between the Canadian dollar and U.S. dollar being approximately consistent with current levels and expectations for the purposes of guidance and otherwise; availability of funds for the Company’s projects and future cash requirements; the Company’s ability to maintain and obtain all necessary permits, licenses and regulatory approvals in a timely manner or at all; no unexpected geological formations or environmental hazards are encountered; prices for diesel, natural gas, fuel oil, electricity and other key supplies being approximately consistent with current levels; tonnage of ore to be mined and processed and ore grades and recoveries remaining consistent with mine plans. While the Company considers these assumptions to be reasonable, they may prove to be incorrect.
Forward-looking Information involves numerous risks, uncertainties and other factors that may cause actual results and developments to differ materially from those expressed or implied by such Forward-looking Information. Such factors include those described in the section “Risk Factors” in the Company’s MD&A for the most recent fiscal year end, and in the section titled “Risks Related to the Business” in Equinox Gold’s most recently filed Annual Information Form, both of which are available on SEDAR+ at www.sedarplus.ca and on EDGAR at www.sec.gov/edgar. Forward-looking Information reflects management’s current expectations for future events and is subject to change. Except as required by applicable law, the Company assumes no obligation to update or to publicly announce the results of any change to any Forward-looking Information contained or incorporated by reference to reflect actual results, future events or developments, changes in assumptions or other factors affecting Forward-looking Information. If the Company updates any Forward-looking Information, no inference should be drawn that the Company will make additional updates with respect to those or other Forward-looking Information. All Forward-looking Information contained in this news release is expressly qualified by this cautionary statement.
Non-IFRS Measures
This news release refers to net present value (“NPV”), cumulative life-of-mine net cash flow, and sustaining capital costs, which are measures with no standardized meaning under International Financial Reporting Standards (“IFRS”) and may not be comparable to similar measures presented by other companies. Their measurement and presentation is intended to provide additional information and should not be considered in isolation or as a substitute for measures of performance prepared in accordance with IFRS. Non-IFRS measures are widely used in the mining industry as measurements of performance and the Company believes that they provide further transparency into costs associated with producing gold and will assist analysts, investors and other stakeholders of the Company in assessing its operating performance, its ability to generate free cash flow from current operations and its overall value. Refer to the “Non-IFRS Measures” section of the Company’s Management’s Discussion and Analysis for the period ended December 31, 2025, for a more detailed discussion of these non-IFRS measures and their calculation.
Cautionary Note to U.S. Readers Concerning Estimates of Mineral Reserves and Mineral Resources
Disclosure regarding the Company’s mineral properties included in this news release was prepared in accordance with National Instrument 43-101 – Standards of Disclosure for Mineral Projects (“NI 43-101”). NI 43-101 is a rule developed by the Canadian Securities Administrators that establishes standards for all public disclosure an issuer makes of scientific and technical information concerning mineral projects. NI 43-101 differs significantly from the disclosure requirements of the Securities and Exchange Commission (the “SEC”) generally applicable to U.S. companies. Accordingly, information contained in this news release is not comparable to similar information made public by U.S. companies reporting pursuant to SEC disclosure requirements.
Photos accompanying this announcement are available at:
https://www.globenewswire.com/NewsRoom/AttachmentNg/db7f6924-90b8-4be9-8e10-943c8e48b6c8
https://www.globenewswire.com/NewsRoom/AttachmentNg/6d2f2313-2635-48d1-a84b-f97fd1bcf470
https://www.globenewswire.com/NewsRoom/AttachmentNg/d255975f-2583-46bb-9828-ef67154a2b46

![]()
Greenstone Gold Mine
Open-pit and Underground Expansion Opportunities
Greenstone Gold Mine
Near-mine and Regional Opportunities
Valentine Gold Mine
Property Overview
Legal Disclaimer:
EIN Presswire provides this news content "as is" without warranty of any kind. We do not accept any responsibility or liability for the accuracy, content, images, videos, licenses, completeness, legality, or reliability of the information contained in this article. If you have any complaints or copyright issues related to this article, kindly contact the author above.
